
How To See A Delay Before It Shows Up On The Programme
A programme update tells you where things ended up. Buffer tells you where they are going. Here is what changes when programme health is recorded daily instead of assembled on a Thursday afternoon.
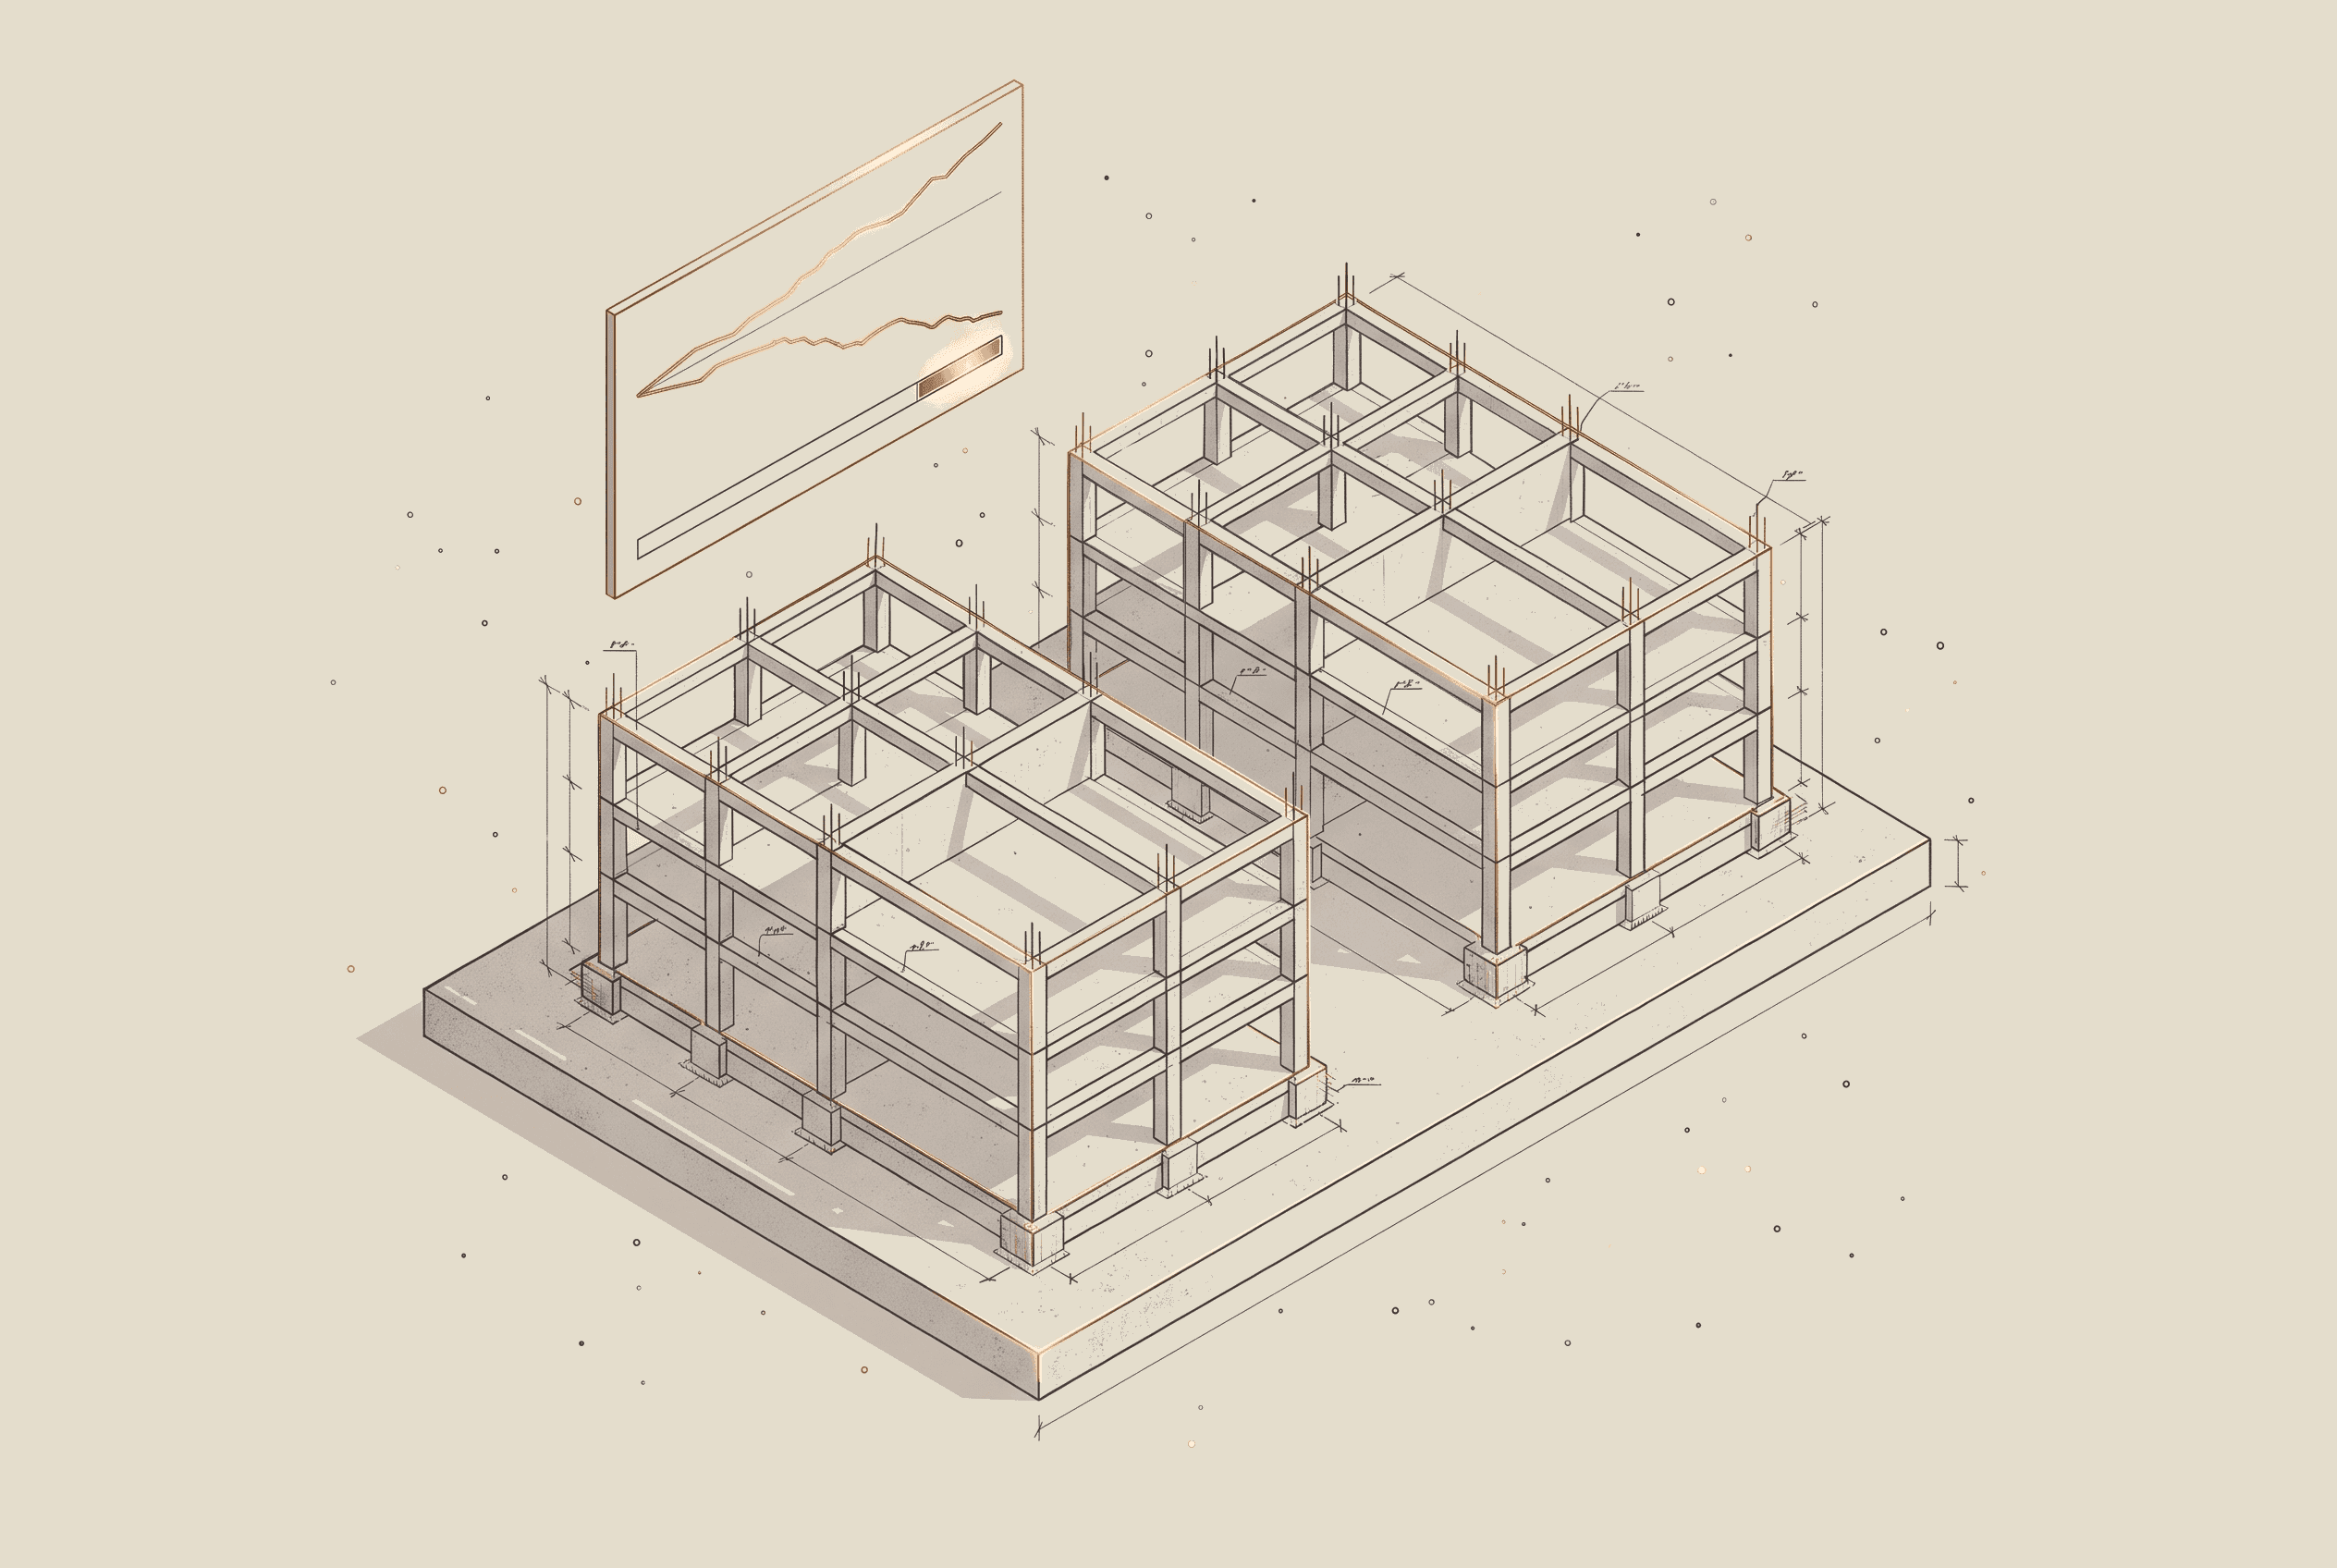
By the time a delay is visible on the programme, it has usually been happening for a while. The activity slips a few days, then a few more. The update that finally shows it is describing something that started weeks earlier. Everybody knew individual pieces of it. Nobody had them in one place.
That is not a planning failure. Programmes are built to show where work ended up against where it was meant to be. They do that well. What they do not do is tell you that something is going wrong while it is still going wrong. For that you need a different measure, taken more often, from the site rather than from the programme.
The report describes the past
A weekly report tells you where things ended up, not where they are heading, because it is assembled after the fact from memory and phone calls. Most weekly reporting is assembled rather than read. Thursday afternoon goes on phone calls to foremen, a chase for delivery confirmations, someone reconstructing Tuesday from memory because the person who was there is on another job. By the time the pack is finished it is an account of a week that has already happened, written partly from recollection.
The people doing this are not doing it badly. They are doing the only thing available when the underlying detail was never captured in a form anyone can pull. And the effort involved is exactly why it happens weekly rather than daily. Nobody is going to reconstruct the day every day.
So the question is not how to write the report faster. It is whether the detail can be captured as the day happens, so that the report is a read rather than a rebuild.
Buffer moves before progress does
Buffer is consumed before progress visibly slips, which is why watching it gives an earlier signal than watching completion. Manufacturing has a habit worth borrowing here. When you are running a process against a target, the useful early signal is not how much you have produced. It is how much of your protection you have used up getting there.
On a construction project that protection is buffer. Float, contingency, the slack between where an activity sits and where it has to sit for the next one to start. Progress and buffer usually move together at the beginning. When they separate, when progress is roughly where you expected but the buffer protecting it has been eaten faster than the work has advanced, something has changed and the programme will not show it yet.
The reason it will not show it yet is arithmetic. An activity absorbs its float silently and reports as on programme right up until the float is gone, at which point it reports as late all at once. The information was there the whole time. It just was not being looked at.
Watching buffer instead of only progress moves the signal earlier. Not because it predicts anything. There is no forecasting involved. It moves earlier because it is measuring the thing that gets consumed first.
What Vector Records And When
Vector is the SiteVector module that holds programme health. Buffer against progress, zone by zone, recorded every day.
The important part is where the numbers come from. They are not entered as a separate exercise. They accumulate from what the site team is already recording through the day, deliveries logged at the gate and task outcomes marked off as work completes. When a day is locked, that day's position is fixed alongside everything else in the record.
Zones are defined once and used the same way for the life of the project, so week three and week thirty are describing the same thing. That consistency is what makes the trend line worth reading. A measure that changes definition halfway through a job is not a trend, it is two different measures drawn on one axis.
What a project manager gets from this is not a prediction. It is a picture that is current rather than a week old, showing which zones are holding and which are consuming more protection than the work they are producing. That is enough to ask a specific question on a Tuesday instead of a general one on a Friday.
The part that comes back out
Vault turns the accumulated daily record into shift diaries, weekly reports, supplier performance and root cause analysis, without anyone compiling them. Vector answers what is happening now. Vault is where the accumulated record turns into something you can actually work with.
The shift diary is generated from the day's entries rather than written separately at five o'clock. Weekly reports pull from the same source. Supplier and subcontractor performance is built from delivery records, arrival against booking, turnaround from gate to departure, rather than from anyone's impression of who is reliable. Root cause analysis groups blocked and incomplete tasks by the reason chosen at the time. And the whole project exports in one go, to Excel, Word or PDF, so it can go wherever you already do your reporting.
None of that requires a separate reporting effort, because all of it is drawn from the record the site team made while doing their normal job.
Why consistency matters more than effort
Consistent categories make a problem countable. Effort alone does not. When a task does not get done in SiteVector, the person recording it picks a reason from a fixed list rather than typing a sentence. Sixteen options, one selected as the primary reason.
That constraint is deliberate and it is the most important design decision in the product. Free text cannot be counted. A fixed list can. One blocked task with a reason attached is an anecdote. Four hundred blocked tasks, categorised the same way, sorted by frequency, is a Pareto chart. A Pareto chart usually says something specific and slightly uncomfortable about where the disruption is actually coming from.
It also means one project is comparable to another. Same reason codes, same delivery classifications, same trade categories, so your project in January can be set against the one starting next month and the comparison holds. Your first project gives you information. Your next gives you something to measure it against.
This is the part of lean construction that survives a project finishing. Percent plan complete, counted honestly for a month, tells you more about how a job is running than most reporting packs manage in a year. It only works if the counting is consistent, which is a matter of structure rather than of anyone trying harder.
What this does not do
Worth being direct, because the gap between what construction software promises and what arrives is well known.
Vector does not forecast. It records buffer and progress and shows the trend. Reading it is a job for the person who knows the project.
There is no AI inferring causes, scoring performance or attributing fault. The data is structured. The judgement stays human.
SiteVector holds no rates and no cost data, so it will not tell you what a delay was worth. It records what was logged on the day and leaves the commercial assessment where it belongs.
And it does not replace your programme tool. Keep Primavera P6, Microsoft Project, Procore, Aconex or whatever else is already running. SiteVector sits underneath, records the ground level detail those systems were never designed to capture and hands it back structured.
One honest limitation. The record is only as good as what the site team enters. A reason chosen carelessly is a reason that will show up in the analysis. What the structure does is make careless entry visible over time rather than invisible forever, which is more than a spreadsheet does.
Where to start
Put it on a project you are already running. Not a new job, not a company-wide decision, nothing to replace. Sixty days, no card. At the end of it you will know whether the site team found it quicker than what they were doing before.
Explore SiteVector
See how Flow, Commit and Vector capture site data in real time.